
Weld Defect Inspection in EV Manufacturing, NDT Acceptance Testing
40
29.09.27
On this page
Overview
About this use case: An EV production line's rule-based inspection system misses roughly 300,000 weld defects per year — and three AI vendors all claim 99%+ detection on reference datasets that bear no resemblance to your welds, your lighting, or your defect mix. tracebloc runs the acceptance test on the manufacturer's own production imagery inside the factory network, where no image leaves and the results are independently scored. Explore the data, submit your own model, and see how your approach compares.
Problem
You're qualifying a new automated visual inspection system for your welding line. Three vendors have submitted proposals. All three claim detection rates above 99%. All three have reference customers. All three have demo videos that look convincing.
The problem is that none of those demos were run on your welds, your lighting conditions, your line speed, or your defect mix. And you can't send your production image library to three external vendors to run their own tests — that data is proprietary, and your data governance team would shut it down immediately.
So how do you know which system will actually hold up in production before you sign the contract?
Solution
tracebloc provides a secure evaluation workspace where vendors test their inspection systems directly on your production data — without that data ever leaving your facility. Once the workspace is deployed on your infrastructure, vendors submit their computer vision models and run their own training, fine-tuning, and line adaptation inside your environment. The orchestration, data access controls, scoring, and leaderboard happen automatically — no manual coordination required. As a federated learning application, the evaluation runs inside your environment: vendors submit their systems, your data never moves, and you get a side-by-side performance comparison on real production welds.
Outcome
In this example evaluation, the independent acceptance test revealed a 4-6% gap between every vendor's claimed detection rate and their actual performance on real production welds. The best-performing system — a YOLOv8-based solution submitted by Vendor B — achieved 98.3% defect detection after adapting to the line conditions, versus the claimed 99.3%. Selecting this vendor over the existing rule-based inspection system saves an estimated €4 million per year in missed defect costs. The tracebloc workspace remains in place as a continuous QA system, running new vendor submissions and updated models as the programme evolves.
The Operational Challenge
Weld quality in EV battery housings and chassis components is not a quality checkbox — it is a structural safety requirement. A micro crack in a battery housing weld can propagate over thousands of charge cycles and thermal events. When it fails, it does not fail quietly. The costs cascade: production stoppage, field investigation, potential recall, warranty claims, and — in the worst case — safety incidents.
Andreas Maier, Head of AI & Automation at a major European OEM's production site, has been tasked with replacing the current rule-based visual inspection system. The existing setup catches around 95% of surface defects — which sounds high until you apply it to scale. At 6,000 welds per vehicle and 1,000,000 vehicles per year, a 5% defect escape rate means 300,000 undetected defects reaching the next quality gate or the field.
The NDT team has been flagging the same categories of misses for two years: micro cracks showing as faint shadows in high-speed inline images, porosity in laser welds on mixed substrates, undercuts on seam welds at the edge of the field of view. Rule-based systems were not built for these. AI-based machine vision inspection systems claim to be. Andreas's job is to find out which one actually delivers — on his line, not on a vendor's reference dataset.
What Andreas Actually Needs to Know
The questions Andreas brings to this evaluation are not data science questions. They are operational questions:
- Will it keep up? The inspection system must clear each weld in under 10 milliseconds to avoid disrupting takt time. A system that is accurate but slow creates a production bottleneck.
- Will it hold up on night shifts? Lighting conditions vary. Spatter residue builds up on lenses. The system must perform at 3am on a weekend with minimal supervision, not just under controlled demo conditions.
- What is the real false alarm rate? A system that flags too many good welds as defective creates a different problem: operators start ignoring alerts, and the system loses credibility on the line.
- How does it handle weld type variation? The line runs spot welds on aluminum battery housings, seam welds on steel chassis components, and laser welds on mixed substrates. A system trained on one weld type often fails on another.
- What happens in six months? When new part variants are introduced, or weld parameters change, does the system degrade gracefully or require a full re-qualification?
Stakeholders
- Head of AI & Automation (Andreas): Leads vendor selection and technical integration. Measured on defect escape rate, line uptime, and the ability to show continuous improvement after deployment.
- Quality Director: Sets the acceptance criteria — ≥99% defect detection, ≥95% precision — and owns compliance with IATF 16949. Signs off on the final vendor decision.
- Manufacturing Engineering: Responsible for integration into the production line without disrupting takt time. Primary concern is inspection speed and system reliability on edge hardware.
- Procurement: Manages commercial negotiations. Needs hard performance data to differentiate between vendor proposals that look similar on paper and justify the selection to finance.
- IT Security / Data Governance: Must ensure no production images leave the factory network. External cloud-based testing is prohibited under internal IP and data protection policy.
The Dataset
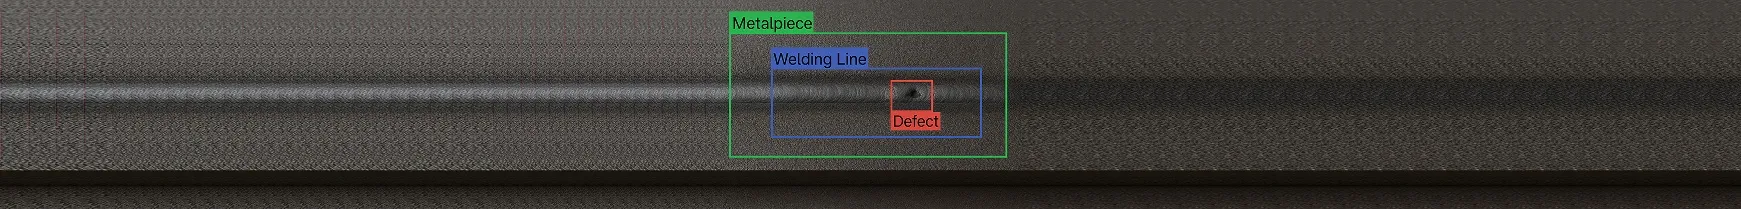
The evaluation draws on an augmented weld image dataset in Pascal VOC format — constructed to closely reflect the defect types, image conditions, and class distributions seen in real automotive production environments, without containing proprietary manufacturer data. Full dataset statistics, class distributions, bounding box analysis, and sample images are available in the Exploratory Data Analysis tab.
| Parameter | Value |
|---|---|
| Total images | 1,018 (814 train / 204 test) |
| Image size | 640 × 640 px, colour (3-channel) |
| Annotation format | Pascal VOC (XML bounding boxes) |
| Object classes | 3 — Defect, Metalpiece, Welding Line |
| Total annotated objects | 8,321 (6,719 train / 1,602 test) |
| Avg objects per image | 8.25 (train) / 7.85 (test) |
| Defect instances | 1,932 — avg bounding box area: 1.6% of image |
| Metalpiece instances | 3,328 — avg bounding box area: 12.3% of image |
| Welding Line instances | 3,061 — avg bounding box area: 3.4% of image |
The small average defect size — 1.6% of the image area — is the core detection challenge. Defect bounding boxes range from 11×11 px at the smallest to over 500×600 px at the largest. Systems that perform well on large objects often miss the small, faint defects that matter most on a production line. Each image contains at least one metal piece with a welding line, and may contain one or multiple defects — matching the structure of a real inline inspection frame.
In a real production deployment, the reference library would grow continuously as more images are captured from the line. This example uses 814 training images — a starting point. Larger and more diverse datasets lead to more robust adaptation and more reliable evaluation results over time.
Independent Acceptance Test Setup
Once tracebloc is deployed on Andreas's factory infrastructure, the evaluation runs with minimal manual overhead. Each vendor receives access to an isolated workspace inside the factory environment. They submit their computer vision model, run their own training and line adaptation using the provided dataset, and receive automated scoring on the held-out test set. Andreas's team sees the ranked results in real time. No images leave the factory. No vendor sees another vendor's submission.
This is the core difference from a standard pilot: vendors work inside your infrastructure, not the other way around. The orchestration — data access controls, training execution, evaluation scoring, leaderboard updates — happens automatically once the workspace is configured.
Evaluation Protocol
Phase 1: Out-of-the-box performance
Each vendor's system is tested as submitted, with no adaptation to the production line. This is the real baseline — what the system actually delivers when installed on a new customer's line without customization. In this example, all three vendors started between 93-94.5% detection on real production welds.
Phase 2: Line adaptation
Vendors are given access to the training environment inside the tracebloc workspace. Each vendor transfers their computer vision model into the workspace and runs training on the 814 annotated production images — fine-tuning their model weights to the specific defect types, image characteristics, and object size distribution of this line. After training, the adapted model is evaluated automatically against the independent 204-image test set. Vendors have no visibility into the test set at any point. The evaluation mirrors an independent third-party acceptance test, not a vendor-run demo.
In production deployments, the reference library can be much larger — thousands or tens of thousands of images accumulated from the line over time. A larger, more diverse training set typically translates directly into stronger line adaptation results.
What Was Measured
- Defect detection rate — percentage of actual defects correctly identified (the critical metric; every miss is a potential field escape)
- False alarm rate — percentage of good welds incorrectly flagged (drives operator alarm fatigue and unnecessary rework)
- Inspection speed — time per weld image on production-equivalent edge hardware
- Performance by weld type — detection rate broken down by defect class where the dataset allows
Results: Claims vs. Independent Test
What Vendors Claimed
| Vendor | Inspection System | Claimed Detection Rate | Claimed False Alarm Rate | Inspection Speed |
|---|---|---|---|---|
| A | DSF-YOLO | 99.1% | <2% | 3 ms/weld |
| B | YOLOv8 | 99.3% | <1% | 7 ms/weld |
| C | Faster R-CNN | 98.8% | <1% | 10 ms/weld |
What the Independent Test Found
| Vendor | Claimed Rate | Out-of-the-Box | After Line Adaptation | Measured Speed |
|---|---|---|---|---|
| A | 99.1% | 94.0% | 96.2% | 4.1 ms/weld |
| B | 99.3% | 94.5% | 98.3% ✅ | 7.8 ms/weld |
| C | 98.8% | 93.2% | 97.9% | 11.2 ms/weld ❌ |
→ View the full model leaderboard — see ranked detection results, false alarm rates, and speed measurements across all submitted systems.
What this means in plain terms:
Every vendor's out-of-the-box detection rate dropped 4-6 percentage points when tested on real production welds versus their reference data. This gap is not unusual — it is the standard reality of deploying vision systems on new production lines. The question is how much the system recovers after line adaptation, and how honest the vendor's original claims were.
Vendor C was eliminated regardless of detection rate: at 11.2 ms per weld, it cannot keep pace with the welding line without creating a bottleneck. Speed is a hard constraint, not a tradeoff.
Vendor B showed the strongest recovery after line adaptation — gaining 3.8 percentage points and coming closest to its original claim. It did not reach 99.3%. No vendor did. But 98.3% on real production data, at 7.8 ms per weld on edge hardware, was the best independently verified result.
Business Impact
The business case for the inspection system investment comes down to one number: how many defective welds escape to the field, and what each one costs.
Cost Assumptions
| Parameter | Value |
|---|---|
| Annual production volume | 1,000,000 vehicles |
| Welds per vehicle | ~6,000 |
| Total welds per year | 6 billion |
| Weld defect rate | 0.1% → 6,000,000 potentially defective welds/year |
| Cost per field defect escape (rework, warranty, recall exposure) | €30 |
Annual Cost Comparison
| Inspection Strategy | Detection Rate | Defect Escapes/Year | Defect Escape Cost | System Cost | Total Annual Cost |
|---|---|---|---|---|---|
| Current rule-based system | ~95.0% | 300,000 | €9.0M | €0 | €9.0M |
| Vendor A | 96.2% | 228,000 | €6.8M | €1.2M | €8.0M |
| Vendor B ✅ | 98.3% | 102,000 | €3.1M | €1.5M | €4.6M |
| Vendor C | 97.9% | 126,000 | €3.8M | €1.4M | €5.2M |
Estimated annual saving with Vendor B: over €4 million versus the existing rule-based system, primarily from reducing defect escapes from 300,000 to 102,000 per year.
The gap between Vendor A and Vendor B (€8.0M vs €4.6M total cost) is driven almost entirely by the difference in detection rate — 96.2% vs 98.3%. At scale, 2 percentage points of detection rate is worth €2.2M per year in avoided defect costs.
Decision
Vendor B's YOLOv8-based inspection system was selected for full inline deployment. At 98.3% detection and 7.8 ms per weld on production edge hardware, it clears the speed requirement and achieves the best independently verified detection rate.
The 98.3% result falls short of the 99% acceptance threshold. Andreas plans to close the gap through targeted labelling of additional defect examples — particularly small defects at the edge of the field of view — and re-validation through the same tracebloc workspace.
Critically, the workspace does not close after the initial selection. It becomes a permanent part of the quality assurance infrastructure:
- As new weld variants or part types are introduced to the line, vendors can resubmit updated models and be re-evaluated against the new conditions
- As the image library grows, evaluation runs on more diverse and representative data — giving progressively more reliable results
- New vendors can be benchmarked at any time, with no additional setup required
- The leaderboard becomes a live record of which systems are performing and which are degrading over time
This continuous QA model is what distinguishes a one-off vendor selection from a sustainable inspection programme. The acceptance test that qualified Vendor B today is the same environment that will flag performance drift six months from now.
The broader lesson applies across federated learning applications in industrial settings: vendor claims made on reference data do not predict performance on production lines. The only way to know which system actually holds up is to run an independent acceptance test on your own data — in your own environment, continuously, not just at purchase.
Explore this use case further:
- View the model leaderboard — ranked detection results across all submitted systems
- Explore the dataset — full EDA including class distributions, bounding box analysis, and sample images
- Start training — submit your own model to this evaluation
Related use cases: See how the same independent evaluation approach applies to drone-based aerial object detection for traffic monitoring and warranty claims classification for automotive manufacturers.
Deploy your workspace or schedule a call.
Disclaimer: The dataset used in this use case is augmented — designed to closely reflect the characteristics of real automotive production weld imagery, but not sourced from any actual manufacturer. The persona, scenario, vendor names, detection rates, and financial figures are illustrative and based on patterns observed across real-world deployments. They do not represent any specific company, product, or contractual outcome.